
Introducing VISQUAL: Scale for measuring visual qualities of graphical user interface elements
Interface aesthetics in our everyday devices have quickly started to garner attention as the means to positively affect usability and satisfaction. Moreover, interfaces that adapt to personal needs are increasingly common, which offers multiple options for different preferences considering layout flexibility and design.
Perceptions of appealing visual aesthetics are subjective making it difficult to find out what individual users think of a design. Therefore, to guide in creating successful interfaces from user perspective, we developed VISQUAL, a measurement instrument that measures perceptions of visual qualities.
VISQUAL is an easy-to-use research instrument for the evaluation of interface designs. It can be used to measure and compare visual qualities of single interface elements (e.g. windows, menus and icons) or entire layouts in any stage of production. The gathered data provides user perceptions of the measured designs, which helps in gauging attractiveness and the need for optimization. This ultimately leads into choosing the right design options for specific purposes and by each target group, given that demographic data is also gathered.
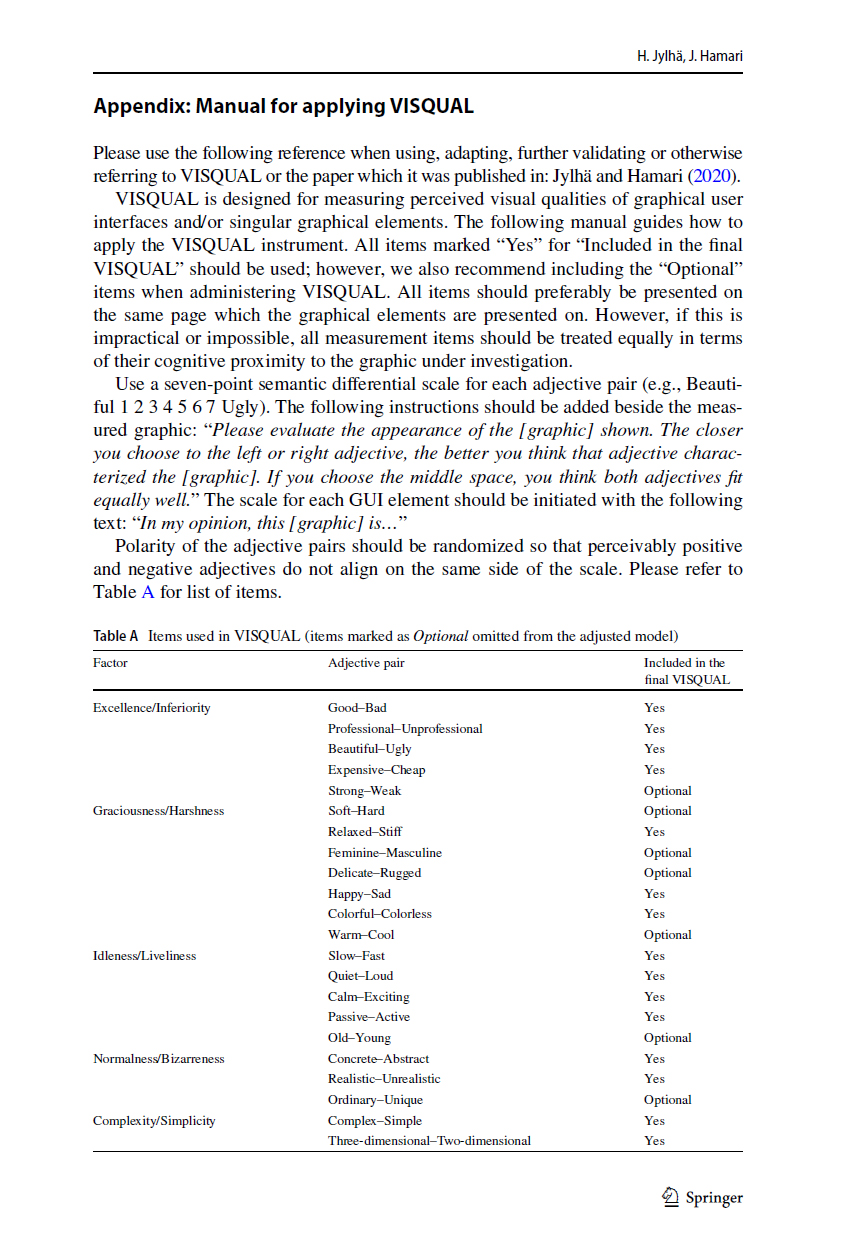
VISQUAL can be used in multiple ways in several contexts related to human-computer interaction, interfaces and their adaption. It consists of 5 dimensions of perceived visual quality: Excellence/Inferiority, Graciousness/Harshness, Idleness/Liveliness, Normalness/Bizarreness and Complexity/Simplicity. These dimensions were produced by a careful review of previous studies which first resulted in a semantic differential scale of 22 adjective pairs. Through exploratory factor analyses, we were able to detect a factorial pattern encompassing the initial 22-item scale. The instrument then evolved further into an adjusted version of 15 adjective pairs.
To employ VISQUAL, use a seven-point semantic differential scale for each adjective pair (e.g., Beautiful 1 2 3 4 5 6 7 Ugly). Assign the questionnaire to each graphic and let participants rate them.
Find the manual on how to use VISQUAL and see the publication for more information.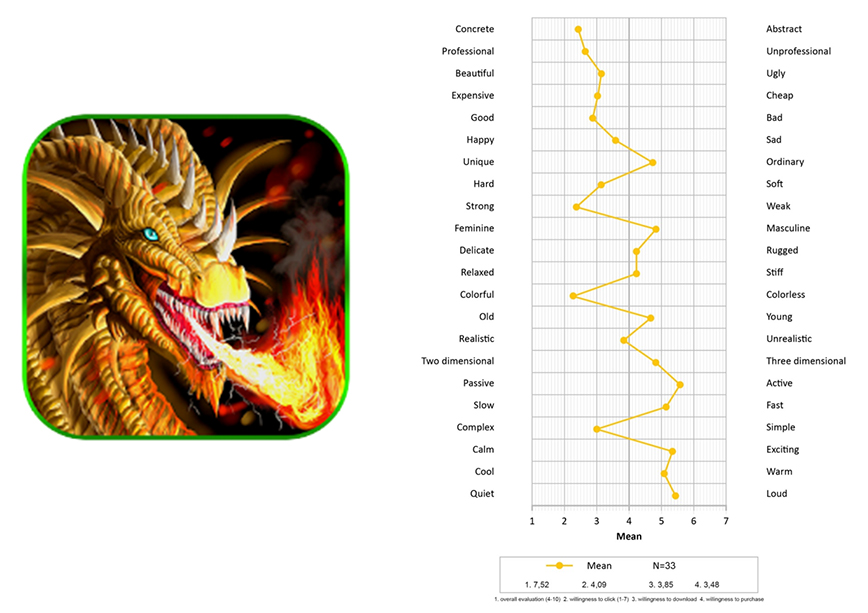
Development of measurement instrument for visual qualities of graphical user interface elements (VISQUAL): A test in the context of mobile game icons
Reference: Jylhä, H., & Hamari, J. (2020). Development of measurement instrument for visual qualities of graphical user interface elements (VISQUAL): A test in the context of mobile game icons. User Modeling and User-Adapted Interaction. Ahead-of-print. doi: 10.1007/s11257-020-09263-7.
See the paper for full details:
Abstract
Graphical user interfaces are widely common and present in everyday human–computer interaction, dominantly in computers and smartphones. Today, various actions are performed via graphical user interface elements, e.g., windows, menus and icons. An attractive user interface that adapts to user needs and preferences is progressively important as it often allows personalized information processing that facilitates interaction. However, practitioners and scholars have lacked an instrument for measuring user perception of aesthetics within graphical user interface elements to aid in creating successful graphical assets. Therefore, we studied dimensionality of ratings of different perceived aesthetic qualities in GUI elements as the foundation for the measurement instrument. First, we devised a semantic differential scale of 22 adjective pairs by combining prior scattered measures. We then conducted a vignette experiment with random participant (n = 569) assignment to evaluate 4 icons from a total of pre-selected 68 game app icons across 4 categories (concrete, abstract, character and text) using the semantic scales. This resulted in a total of 2276 individual icon evaluations. Through exploratory factor analyses, the observations converged into 5 dimensions of perceived visual quality: Excellence/Inferiority, Graciousness/Harshness, Idleness/Liveliness, Normalness/Bizarreness and Complexity/Simplicity. We then proceeded to conduct confirmatory factor analyses to test the model fit of the 5-factor model with all 22 adjective pairs as well as with an adjusted version of 15 adjective pairs. Overall, this study developed, validated, and consequently presents a measurement instrument for perceptions of visual qualities of graphical user interfaces and/or singular interface elements (VISQUAL) that can be used in multiple ways in several contexts related to visual human-computer interaction, interfaces and their adaption.
Sorry, the comment form is closed at this time.