ROOK! Playful data visualization for air quality
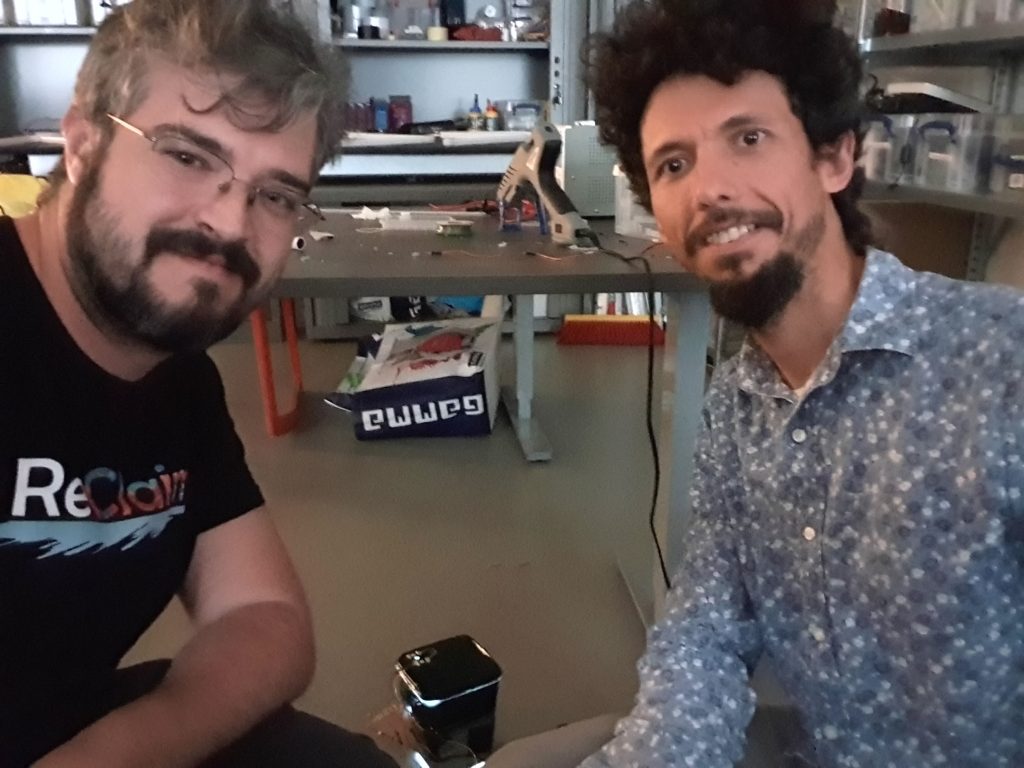
Rook is playful data visualization device aiming at the dissemination of air quality data, developed by Gamification Group member Mattia Thibault and Artur Cordeiro, in partnership with Waag, and with the collaboration of Yuri Alexsander, Mar Escarrabill, Luis Rodil Fernandez and Jéssyca Rios (full credits at the end of the post).
The Rook unit accesses the database of the Hollandse Luchten project, retrieves precise and up to date information on air quality in Nord-Holland, and displays it in an interactive way using lights and mist. The eerie and mysterious effect of the coloured mist has a playful and enticing effect on its users, but Rook, at the same time, spreads awareness on one of the key sustainability issues of the region.
A wandering unit
The Rook unit is meant to be positioned in open public spaces, both inside (in museums, fab labs etc.) and outside. People should be able to interact freely with the machine so to explore its working and the data it conveys. After its creation, the Rook unit has been displayed in several occasions:
- 30 November 2019 – Rook was part of the celebrations 25th Anniversary of De Waag
- 4 December 2019 – Rook will be presented at a conference with the deputies of Utrecht Province
- 22 December 2019 – Rook will be moved to Brak, in Ijnmuiden, for a celebration with the local alderman.
Brak will continue hosting Rook in the future. Brak is a place where researchers, scientists, policymakers, students look for solutions for the environmental challenges. It is a science center working on climate change, organising experiments and discussing with the community. It organises many public activities, has a citizen science research programme and work with schools on educational activities related to the protection of the environment.
How it works
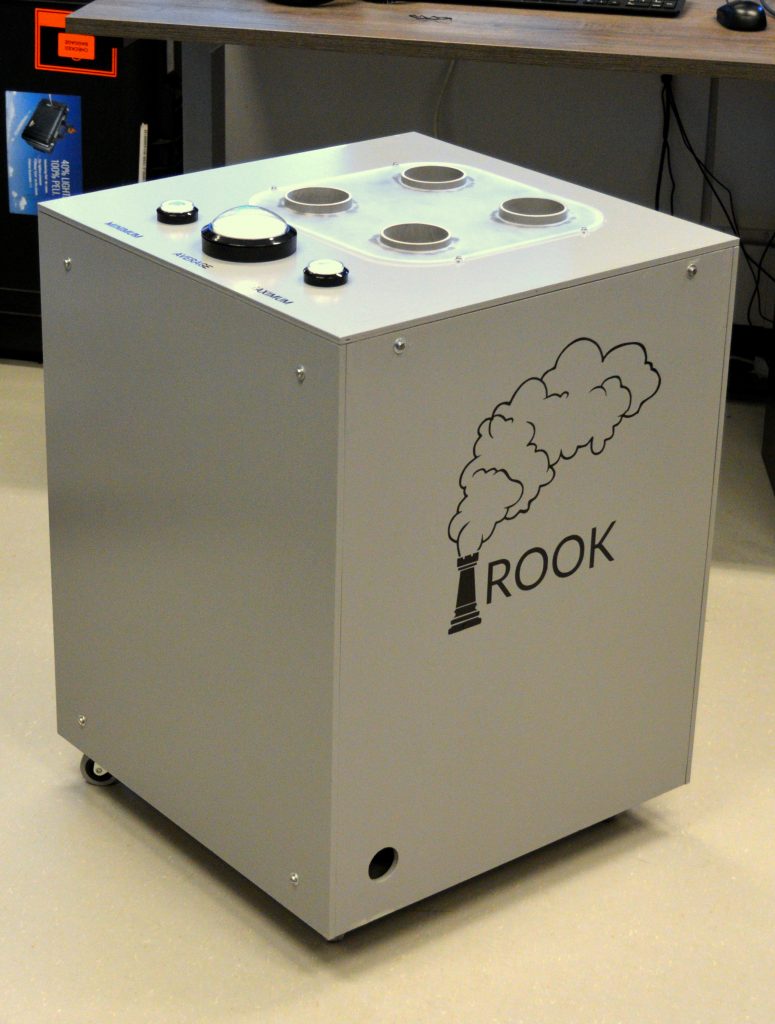
The Rook unit is a 54 x 54 x 72 cm (length x depth x height) machine. When activated, the mist-maker inside the unity, by means of ultrasonic vibration, produces mist from clean water, that will be expelled on top of th
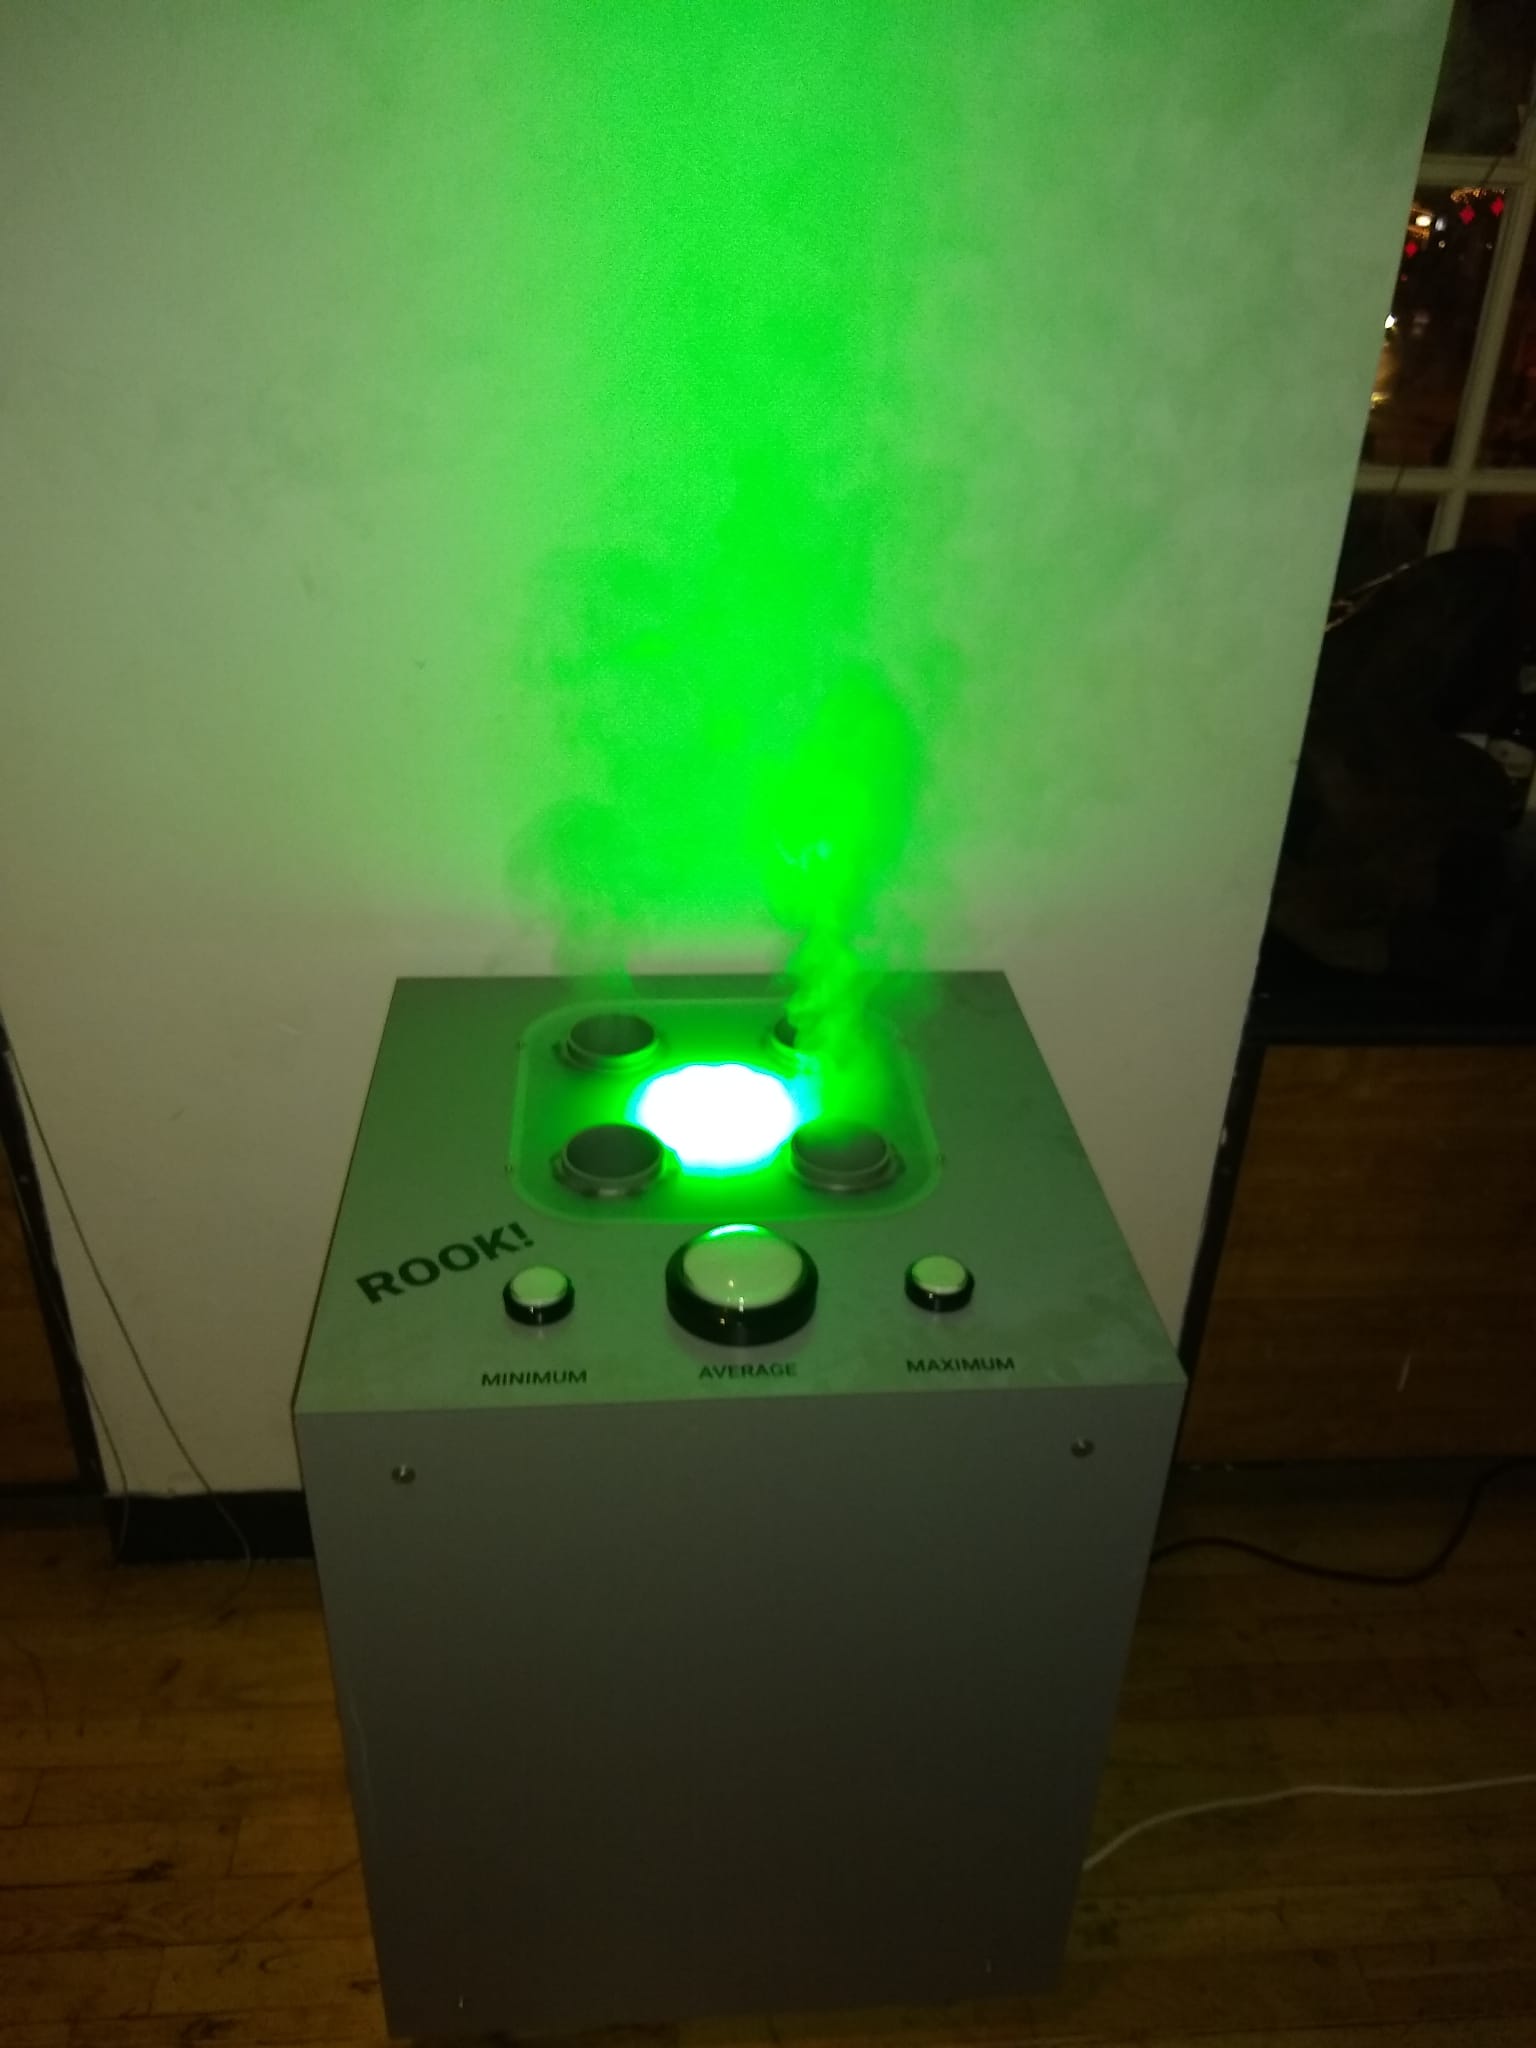
e unit and coloured with the help of RGB light, producing an haunting effect. The colours of the mist represent the air quality registered by one of the Hollandse Luchten sensor kit. Rook is connected to WiFi and its code allows it to retrieve the hourly data of Particulate Matter 2.5 micrometers (PM25) using the Hollandse Luchten API.
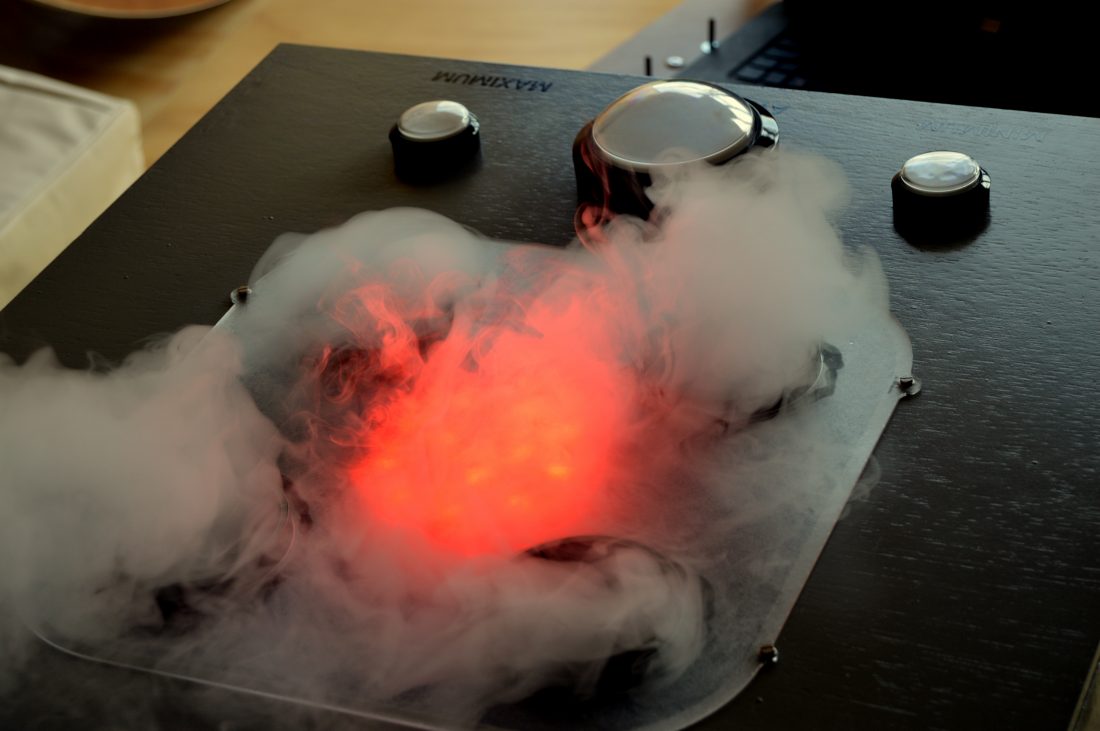
The colours are coded accordingly with the system used in Hollandse Luchten mappings, using a wide spectrum ranging from green (a low concentration of PM2.5) to yellow (a medium level), to red (indicating a high level). The color exhibited in Rook is equivalent to the color displayed in the Hollandse Luchten map platform.
Rook has three different buttons. When activated they will show the hourly average, minimum and maximum levels of PM 2.5 from a specified sensor kit.
The users can experience the changes in air quality by pressing the different buttons and seeing the colours of the smoke change. However, Rook’s mist is not only for show: being perfectly safe, players can touch it, play with it, smell it, blow it away, getting their face covered with it and so on. In other words, Rook allows a playful interaction with the mist.
At the same time, however, the mist often acquires rather menacing nuances of red, indicating an high level of pollution. The interaction, therefore, remains playful but becomes also worrying. This dissonance – represented also in the name of the project “rook” being a chess piece in English and meaning “smoke” in Dutch – is how Rook aims to be effective.
Smoke design
Rook main objective is to offer a way of visualizing, in public spaces, air quality using data from the database of Hollandse Luchten, while proposing a collective and playful experience.
While designing this project two main principles guided our decisions. First, we wanted to avoid a top-down approach in which we propose “our” solution to the users: instead we decided to find a way of communicating the data without framing them as a problem nor offering any specific solution. Second, albeit we are aware that design is never neutral, we still struggled for making the data visualisation device as transparent as possible.
Our design rationale was based on an exploration of the metaphoric potential of using air as a medium to illustrate data about air itself. We aimed at making air and air quality “visible”, creating a machine that would “reveal” its invisible properties.
At the same time, we wanted to design in a critical and playful way, according to the principles of critical playable cities (Hassan & Thibault 2019). In this way we wanted to tap in the ability of playfulness to raise interest and spark creativity and use it to offer an opportunity to the users to think critically about the environmental conditions in which they live.
The Rook project is a research-through-design project as well. The main research questions we aim to investigate are:
1) The possibilities to find a balance between smart and playful city (de Waal & Dignum, 2017; de Lange, 2019);
2) The ways of integrating smart citizen initiatives with media architecture (Gabrys, 2019; Valkanova, Jorda & Moere, 2015);
3) Researching the potentials of toyfication (Thibault & Heljakka, 2019) in data visualisation.
Open and free
Rook is an open project, you can find its instructions guide and arduino code available on GitHub!
Credits:
The Rook project has been developed in 2019 by Mattia Thibault and Artur Cordeiro in partnership with Waag, and with the collaboration of Yuri Alexsander, Mar Escarrabill, Luis Rodil Fernandez and Jéssyca Rios.
The first version of the idea was developed by a team composed by Mattia Thibault, Artur Cordeiro, Yuri Alexsander, Hao-Yung Chang and Gijs Boerwinkel for the Heerlijk Helder Hackathon organised by Waag that took place during “air quality day”, 20th June 2019 in Beverwijk, Netherlands. The instructions were to devise a physical data visualisation strategy to disseminate the air-quality data that will be collected with a series of sensors to be deployed in the city. The low-fi prototype realised for the occasion was chosen by the jury as the best project of the hackathon.
We acknowledge Lectorate of Play & Civic Media from Faculty of Digital Media and Creative Industry of Amsterdam University of Applied Sciences, for offering spaces and competences for the creation of the project.
This project has received funding from the European Union’s Horizon 2020 research and innovation programme under grant agreement No 723521 and under the Marie Sklodowska-Curie grant agreement No 793835.
We acknowledge São Paulo Research Foundation (FAPESP) for the grant #2018/26544-0. “The opinions, hypotheses and conclusions or recommendations expressed in this material are the responsibility of the author(s) and do not necessarily reflect the vision of FAPESP”
Pictures by Mar Escarrabill and Jéssyca Rios.
References
GABRYS, J. (2019) Sensing the air and experimenting with environmental citizenship. In: The Playful Citizen: Civic Engagement in a Mediatized Culture. Vol. 1. Amsterdam: Amsterdam University Press. www.jstor.org/stable/j.ctvcmxpds.
DE LANGE, M. (2019) The playful city: citizens making the smart city. In: The Playful Citizen: Civic Engagement in a Mediatized Culture. Vol. 1. Amsterdam: Amsterdam University Press. http://www.jstor.org/stable/j.ctvcmxpds.
DE WAAL, M.; DIGNUM, M. (2017 )The citizen in the smart city. How the smart city could transform citizenship. In: it – Information Technology, v. 59(6), p. 263-273. https://doi.org/10.1515/itit-2017-0012.
THIBAULT, M.; HELJAKKA, K. (2019) Toyfication – A conceptual statement in G. Brougère and M. Allen 8th International Toy Research Association World Conference , Jul 2018, Paris,
VALKANOVA, N.; JORDA, S.; MOERE, A. V. (2015) Public visualization displays of citizen data: Design, impact and implications. In: International Journal of Human-Computer Studies, v. 81, p 4-16. https://doi.org/10.1016/j.ijhcs.2015.02.005.
Sorry, the comment form is closed at this time.