Introduction
This dataset is the primary evaluation dataset for the paper. TUT-SED Synthetic 2016 contains of mixture signals artificially generated from isolated sound events samples. This approach is used to get more accurate onset and offset annotations than in dataset using recordings from real acoustic environments where the annotations are always subjective. This page explains how this synthetic dataset was created.
Mixture signals in the dataset are created by randomly selecting and mixing isolated sound events from 16 sound event classes together. The resulting mixtures contains sound events with varying polyphony. All together 994 sound event samples were purchased from Sound Ideas. From the 100 mixtures created, 60% were assigned for training, 20% for testing and 20% for validation. The total amount of audio material in the dataset is 566 minutes.
Different instances of the sound events are used to synthesize the training, validation and test partitions. Mixtures were created by randomly selecting event instance and from it, randomly, a segment of length 3-15 seconds. Between events, random length silent region was introduced. Such tracks were created for four to nine event classes, and were then mixed together to form the mixture signal. As sound events are not consistently active during the samples (e.g. footsteps), automatic signal energy based annotation was applied to obtain accurate event activity within the sample. Annotation of the mixture signal was created by pooling together event activity annotation of used samples.
Isolated samples
Isolated sound event samples were selected from commercial sound effects catalog sound-ideas.com. The sound event classes are selected so that they have a sufficient amount of samples in the mentioned sample sources that can provide a general, realistic representation of the class. In the catalog each sample has a textual label, and the samples sharing the same label are combined under the corresponding sound event class. The sample selection produced material from 58 sound event classes, and this was later narrowed down to 16 to have representative amount of samples in training, validation, and testing.
Cross-validation setup
The initial samples are assigned either for training, test and validation. The catalog contains samples that are parts of a single, longer recording and they are cut for shorter excerpts. This is problematic for the evaluation, if excerpts extracted from same recording are used in training and testing as this would lead over optimistic evaluation scores. Ideally these samples should be grouped into same sets, in order to avoid recognizing samples by the external factors that are similar in each track. The samples from each sound event class are grouped according to their track identification numbers and the groups are randomly distributed into training, test and validation sets, satisfying that roughly 60% of the samples per sound event class are used in training, 20% in test and 20% in validation sets.
Finally, in order to make sure that there is a certain degree of variance among the samples and they would provide a general representation of their sound event classes, the classes with less than four validation samples or less than five test samples are discarded. After this process, the dataset contains material from 16 sound event classes and a total of 976 isolated samples were used. The sample distribution for the sets and the total amount of annotated material per class in seconds are given in Table below.
| Event Class | Train | Test | Validation | Data amount (sec) |
|---|---|---|---|---|
| Alarms & Sirens | 26 | 8 | 9 | 4405 |
| Baby crying | 20 | 5 | 5 | 2007 |
| Bird singing | 64 | 21 | 21 | 2298 |
| Bus | 14 | 5 | 4 | 3464 |
| Cat meowing | 39 | 7 | 6 | 941 |
| Crowd applause | 27 | 7 | 6 | 3278 |
| Crowd cheering | 17 | 6 | 7 | 4825 |
| Dog barking | 25 | 5 | 11 | 716 |
| Footsteps | 178 | 58 | 58 | 1173 |
| Glass smash | 49 | 18 | 13 | 621 |
| Gun shot | 15 | 5 | 5 | 534 |
| Horse walk | 28 | 9 | 9 | 1614 |
| Mixer | 12 | 5 | 4 | 4020 |
| Motorcycle | 26 | 9 | 8 | 3691 |
| Rain | 43 | 15 | 15 | 3975 |
| Thunder | 28 | 9 | 10 | 3007 |
Mixtures
Sample processing
Samples were downmixed to a single channel and peak normalization is applied by subtracting the mean value from the sample and scaling the maximum absolute amplitude to one. The silent periods at the beginning and at the end of the samples are trimmed based on signal energy. The RMS energy is calculated in 20 ms frames, and 40% of the average RMS energy of the whole sample is used as trim threshold. Starting from the beginning of the sample, the frames are discarded until a frame with RMS energy over both the trim threshold and an absolute trim threshold of 0.015 is reached. Same is done starting from the end to discard the end silence.
In order to take into account the considerable duration differences between the samples, sample are divided into equal length segments. The segment length is sampled from discrete uniform distribution U(3,15) seconds. The remainder part at the end of the sample is discarded. If the sample is shorter than the randomly chosen segment length, the whole sample is used in the mixture. In case of multiple segments, one of them is randomly chosen to be included in the mixture. Note that different segments of the same sample can be used at different time instances in a mixture and also in different mixtures either in the training, test or validation sets.
Produced segments are peak normalization before random amplitude gain factor is applied, to emulate the amplitude variation effect in real-life recordings. The gain factor is sampled from uniform distribution U(1.0, 3.162), which corresponds to a 0 to 10dB gain. Finally, the first and last half second of the segment are windowed with the first and last half-second of a one second long Hamming window to avoid discontinuities caused by the segmentation.
Sample annotation
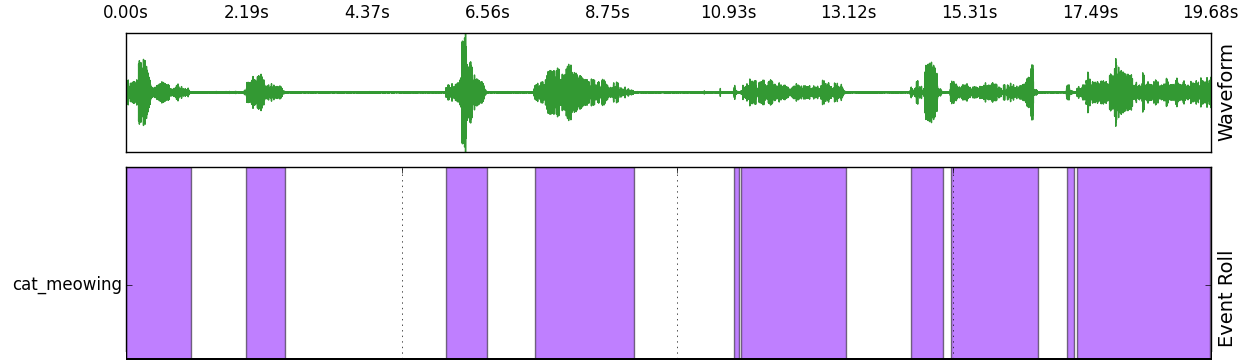
Since the sound event class may not be consistently present in the sample (e.g. silent segments between foot steps), accurate activity annotation of each sample is necessary. An automatic energy-based annotation approach is to get accurate activity annotations. In this approach, RMS energy is calculated for each frame and average RMS energy over the whole signal is calculated. A class-specific silence threshold is empirically adjusted (value between 0.05 and 0.50) to assign frames either active or non-active. Finally, sliding window is used as post-processing to smooth out single non-active frames between many active frames. Post-processing is applied in four-frame blocks with 75% overlap, and frame blocks with 3/4 active frames are assigned to fully active. Example of the automatic annotation produced for sample containing cat meowing:
Synthesis
The processed segments are used to synthesize 100 polyphonic mixtures of eight minutes length. For each mixture, the sample segments from N randomly selected classes were used, where N is sampled from discrete uniform distribution U(4,9). This gives a maximum polyphony of N at any given time. The mixture was synthesized class-by-class, and the N class tracks were then mixed together. Class specific tracks were generated as follows:
- a random period of silence (from discrete uniform distribution U(0,27) seconds) was generated at the beginning of the track,
- a sample instance was randomly selected from the available samples and placed on the track. Event activity annotation acquired for the selected sample segment was collected,
- a random period of silence (U(3,30) seconds) was generated between consecutive segments,
- the process was repeated until the pre-determined mixture length was reached.
The annotations of class specific tracks were pooled together to form the annotation for the mixture. This random synthesizing method may produce long portions with silence between sound events. In the post-processing stage these silent parts were reduced to maximum one second. This reduced the mixture lengths from 480 seconds to an average of 337 seconds. The statistics of the final dataset are presented in Table.
Statistics of the dataset
The dataset is aimed to have considerable amount of polyphonic segments in order to simulate the real-life cases more realistically. The data amount percentage per polyphony in frames and in one-second blocks is presented in following tables.
| Set | 1 | 2 | 3 | 4 | 5 |
|---|---|---|---|---|---|
| Train | 56.6 | 30.3 | 10.2 | 2.4 | 0.5 |
| Test | 49.4 | 32.4 | 13.9 | 3.7 | 0.4 |
| Validation | 51.6 | 33.6 | 11.2 | 3.2 | 0.3 |
| Set | 0 | 1 | 2 | 3 | 4 | 5 |
|---|---|---|---|---|---|---|
| Train | 18.0 | 55.0 | 21.0 | 5.0 | 0.8 | 0.1 |
| Test | 14.8 | 52.0 | 24.5 | 7.4 | 1.1 | 0.1 |
| Validation | 17.4 | 53.2 | 22.9 | 5.6 | 0.9 | 0.1 |
Download
Dataset access rights
The dataset is intended for academic research only. The content of this dataset is password protected. In order to obtain your user name and password to download this dataset, please read, sign and send a scanned copy of the End User License Agreement (below) to toni.heittola@tuni.fi.
EULAAcoustic feature extraction parameters:
- log mel energies
- 40 mel bands (htk type mel equation, 0hz-22050hz) from magnitude spectra
- Frame length 40ms, frame hop length 20ms
- FFT length 1024