Massive-scale tree modelling from TLS data
aTampere University of Technology, Tampere, Finland bForest Research, Farnham, UK cWageningen University, Wageningen, Netherlands dMelbourne School of Land and Environment, University of Melbourne, Australia
QSM - Quantitative Structure Model
Previous work
- Compact tree model with topology and geometry.
- Branching structure &
branching order. - Volumes, lengths, angles, etc.
- Hierarchical collection of cylinders.
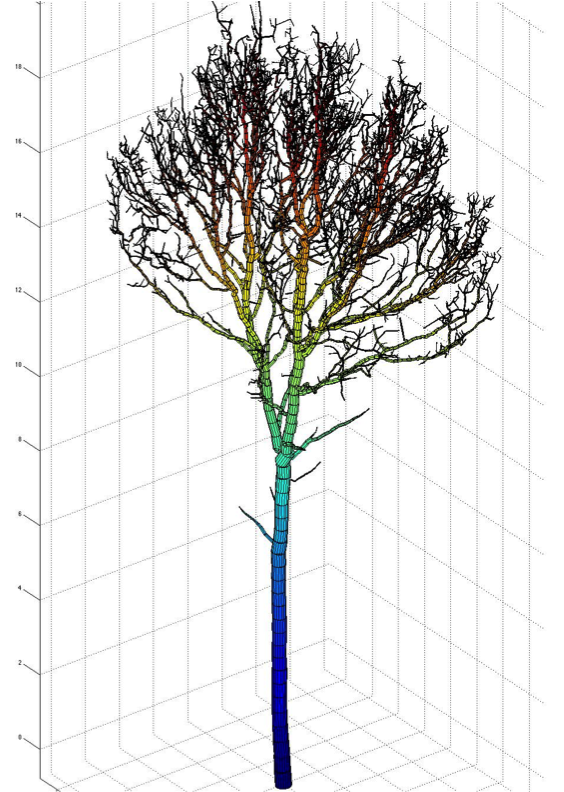
Single tree reconstruction
Previous work
- TLS from a few positions around tree.
- Manually extract single tree.
- Reconstruct a QSM.
- Total biomass from QSMs overestimated by 9.7% while local allometric equations show an underestimation between 29.9% and 36.6%. (65 sampled Eucalyptus trees, Calders et al. 2015)

Motivation for plot-level reconstruction
- Accurate biomass estimates.
- Ground truth data for airborne measurements.
- Cheap measurements.
- Biomass estimation non-destructively.
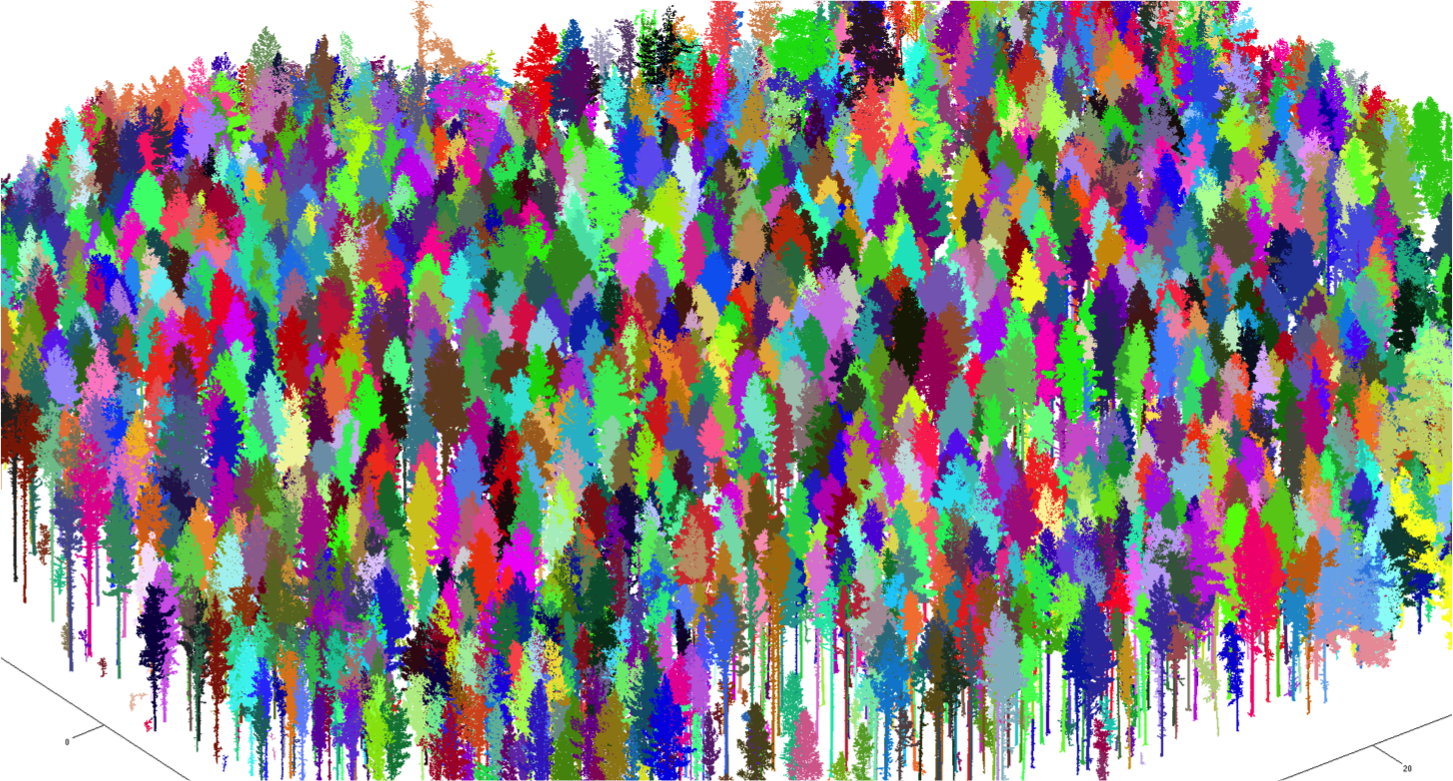
Forest plot reconstruction
- Perform TLS from several locations inside a forest plot.
- Register to single point cloud.
- Plot-level: tree extraction
- Remove ground and under-growth.
- Automatically extract trees based on segmentation.
- Tree-level reconstruction
- Segment into branches.
- Reconstruct each branch with multiple cylinders.
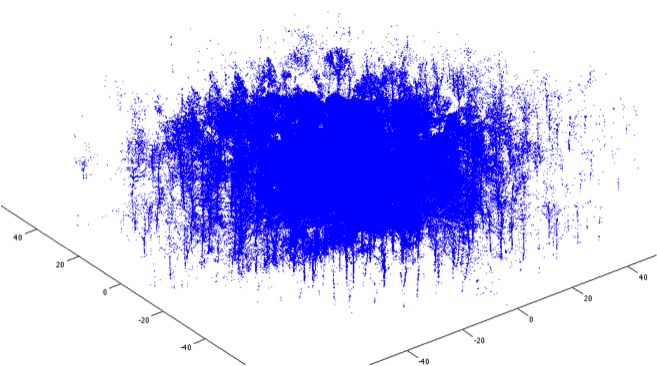
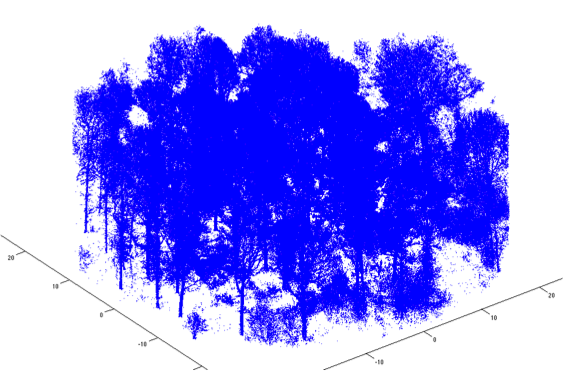
Filtering
Algorithm details
- Remove points outside plot.
- Remove some ground and under-story points.
- Remove low point density regions and small separate clusters.
- Make high point density regions sparser.
- Large reduction in point count.
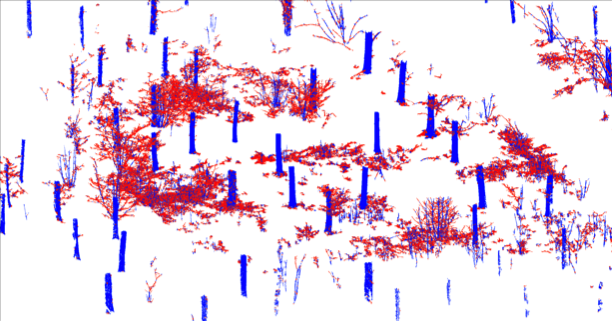
Stem extraction
Algorithm details
- Partition the point cloud into small subsets corresponding surface patches in tree and other surfaces.
- Use the patches and heuristics to locate the stems.
- Patch surface normal approximately horizontal.
- Large patch components define the stems.

Tree extraction
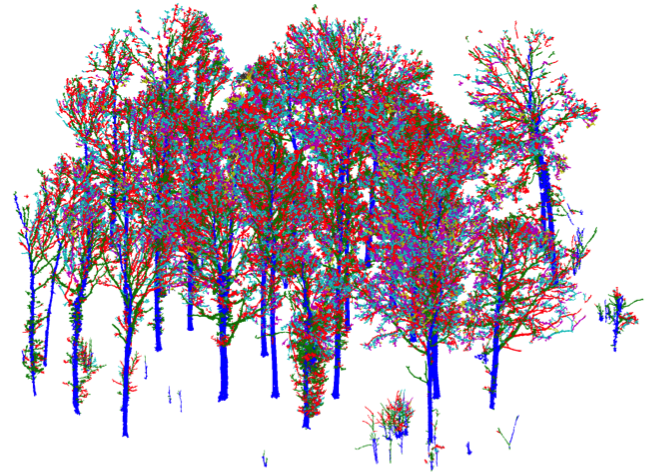
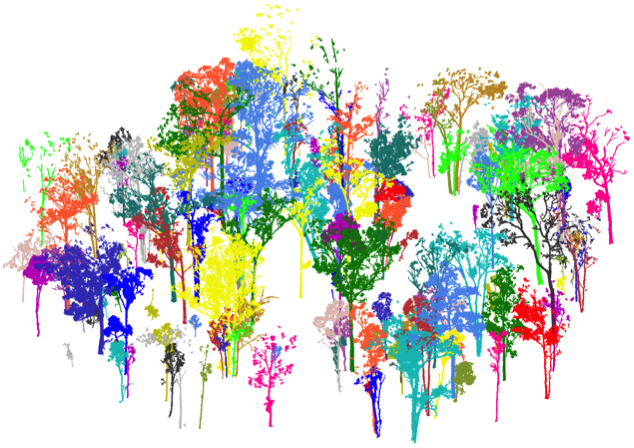
Algorithm details
- Segment the patches into stems and branches.
- Restrict the trees inside the plot.

Test case: Oak plot

- South-Eastern England
- Species: Quercus robur L.
- Five scans, leaf-off
- Leica HDS-6100
- Reference biomass from
allometric equation.
Test case: Eucalyptus plot
- Victoria, Australia
- Species: Eucalyptus leucoxylon,
E. microcarpa and E. tricarpa. - RIEGL VZ-400
- Reference biomass
from destructive
harvesting of 27 trees.
Test cases
| Oak plot | Eucalyptus plot | |
|---|---|---|
| Plot radius | 15 m | 40 m |
| Number of scans | 5 | 5 |
| Resolution | 0.036° | 0.060° |
| Leaves | off | on |
| Millions of points | 124 | 71 |
| After filtering | 35 | 33 |
Results
Results
| Oak plot | Eucalyptus plot | |
|---|---|---|
| Number of trees | 15 | 120 / 27 |
| Modeling time (1 x QSM) | 100 min | 160 min |
| Modeling time (5 x QSM) | 240 min | 540 min |
| Average error per tree | 24.0% | 28.5% |
| Total error per plot | ↑ 15.0% | ↑ 8.5% |
Computations: MacBook Pro 2.8GHz, 16GB, Matlab.
Conclusion
- Fast and accurate massive scale tree modelling is possible from TLS data.
- Tree extraction and modelling in hours.
- Total plot level biomass were overestimated by 8% and 15% in the test cases.
- The method seems to be robust.
- Two different plots with different species, scanners and resolutions.
- Parameters tested for sensitivity.
- Multi-hectare forest regions possible.
